Portfolio · Support Command Center

One console. Every product.

The Support Command Center is the internal platform our team runs Majoto's products from — live operations dashboards with real request telemetry, per-application traces that reconstruct everything our agents did, a staff ticket console with role-based access, and the public support portal our users see. It's internal software, so you can't log in — but here's what it looks like from the inside.

Internal platform

Screenshots are from the real application populated with seeded demonstration data — every name, email, application, and ticket shown is synthetic. Shots follow your theme: the console ships matching light and dark themes on one warm, high-density palette, and this page swaps between the two with the toggle above.

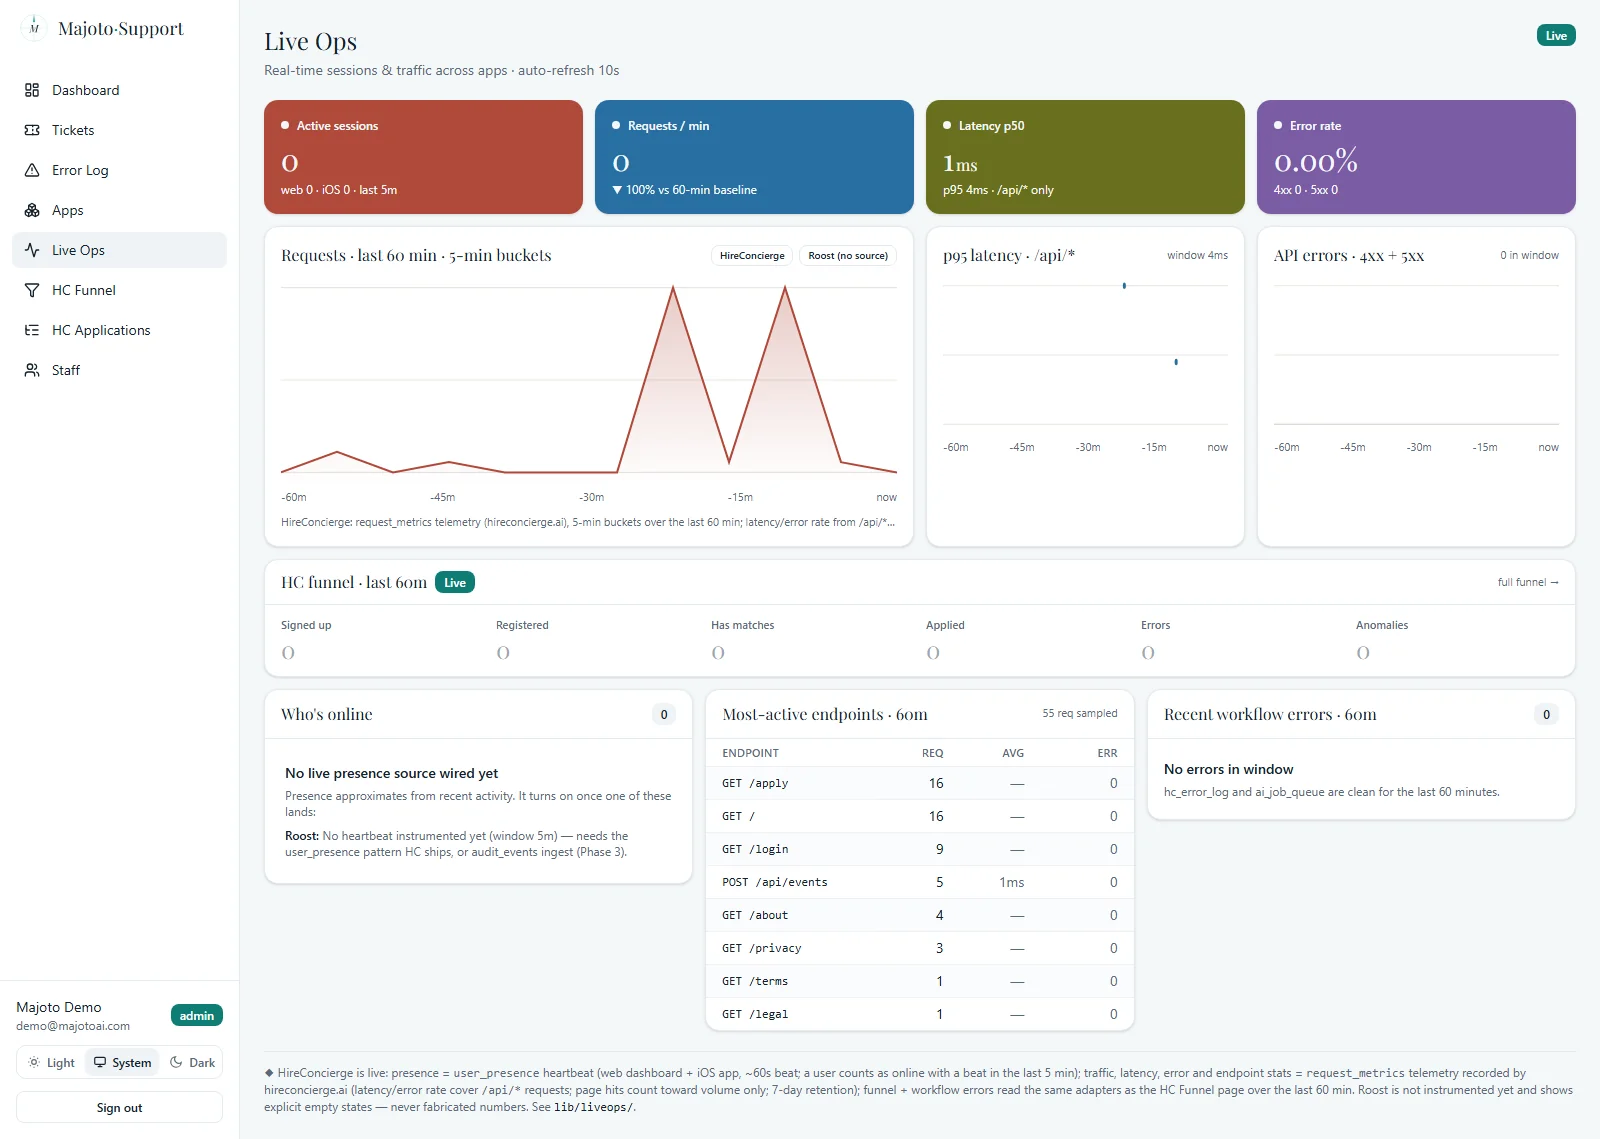
Live Ops dashboard in dark theme: session, request, latency and error-rate KPI tiles above a three-chart row of requests, p95 latency and API errors, a funnel snapshot strip, and who's-online, most-active-endpoints and workflow-error panels Live Ops dashboard in light theme: session, request, latency and error-rate KPI tiles above a three-chart row of requests, p95 latency and API errors, a funnel snapshot strip, and who's-online, most-active-endpoints and workflow-error panels

Live Ops dashboard

Real-time operations across every app in the estate on one screen — active sessions from live client heartbeats, request throughput with spike detection against baseline, and a three-chart row of traffic, p95 latency, and API errors over the last hour, all from real request telemetry. Below it: a live signup→apply funnel snapshot, who's online right now, the hottest endpoints, and recent workflow errors. It's built on an honesty contract: any source that isn't instrumented yet renders an explicit empty state, never a fabricated number.
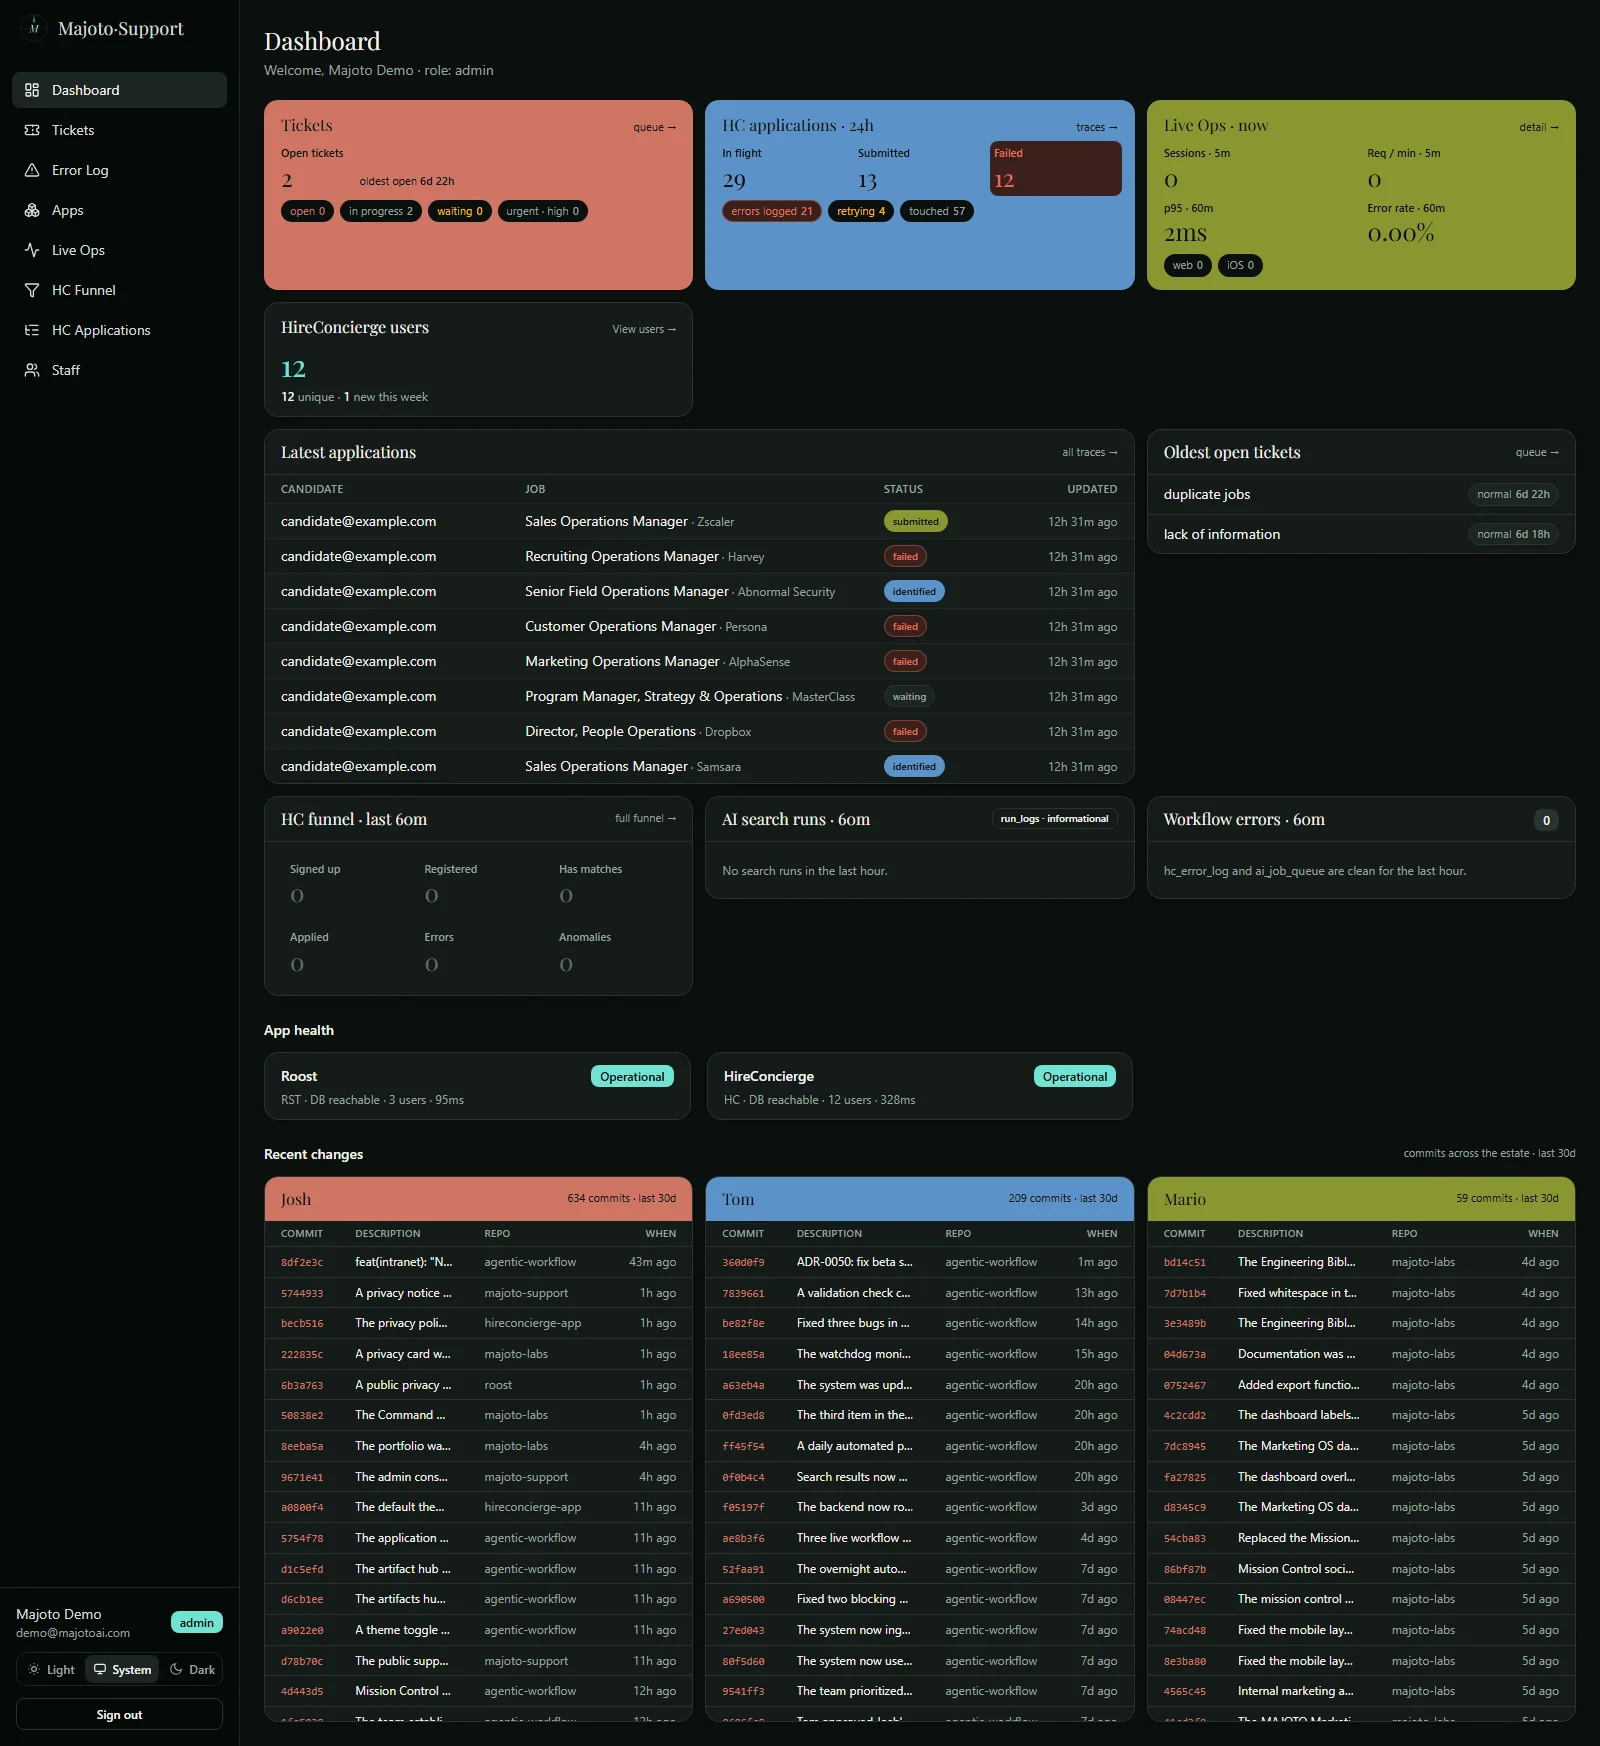
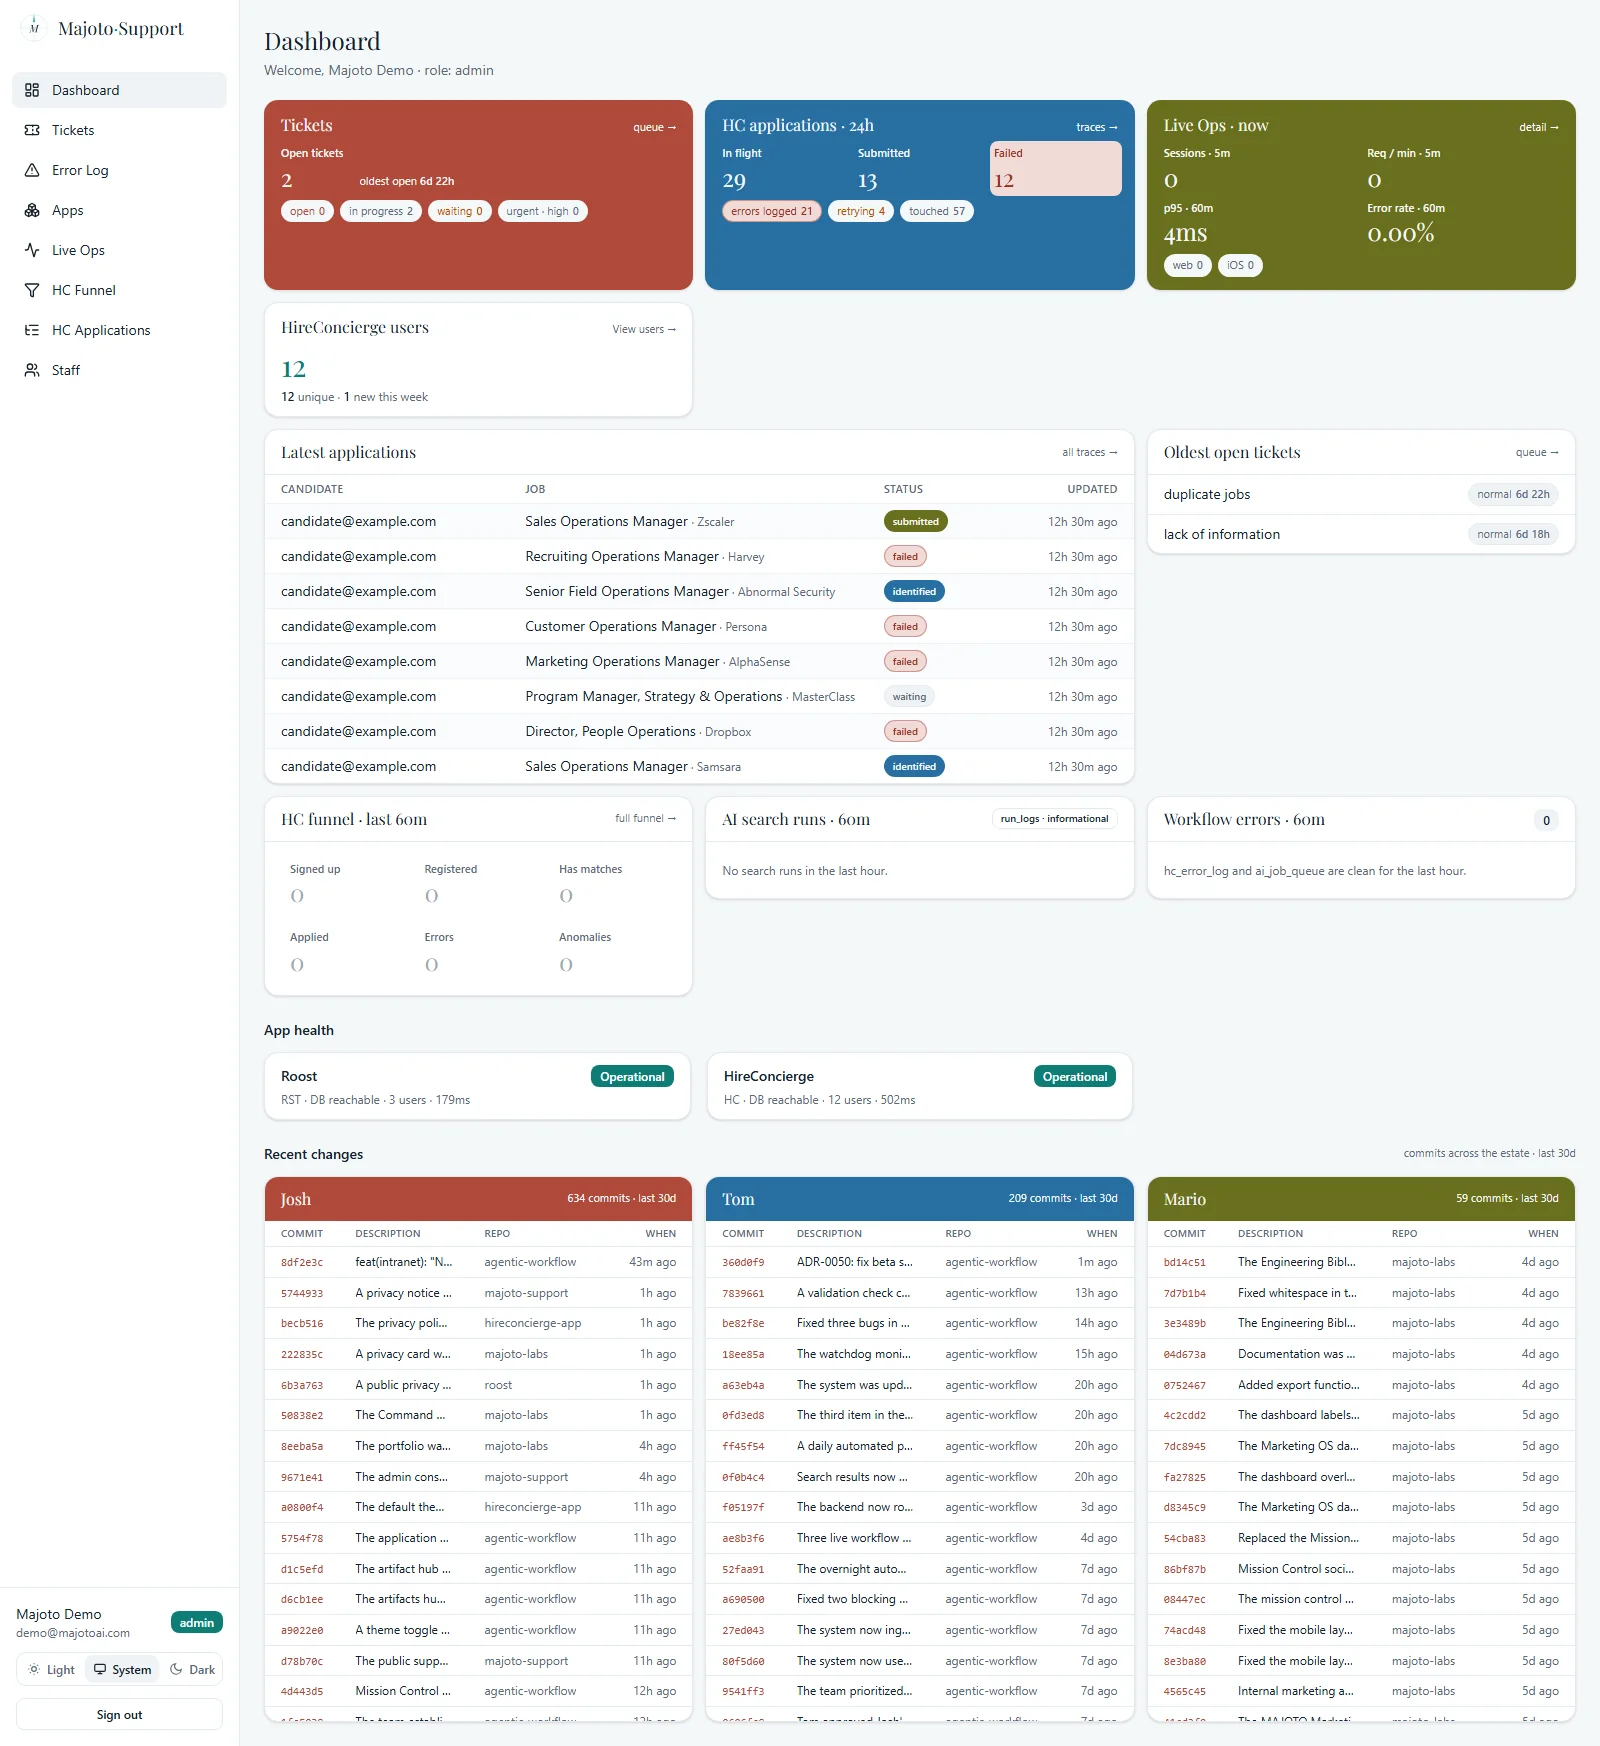
Command Center dashboard in dark theme: solid color-coded ticket, application and live-ops KPI tiles, a latest-applications table, oldest open tickets, funnel pulse, AI search runs, workflow errors and app health cards Command Center dashboard in light theme: solid color-coded ticket, application and live-ops KPI tiles, a latest-applications table, oldest open tickets, funnel pulse, AI search runs, workflow errors and app health cards

Operator dashboard

The first screen a support operator checks: open-ticket load and the oldest items aging in the queue, the last 24 hours of automated job applications (successes and failures), live session and error tiles, a funnel pulse for the past hour, recent AI search runs, and per-app health — every number backed by a real source, each tile linking into its detail page.
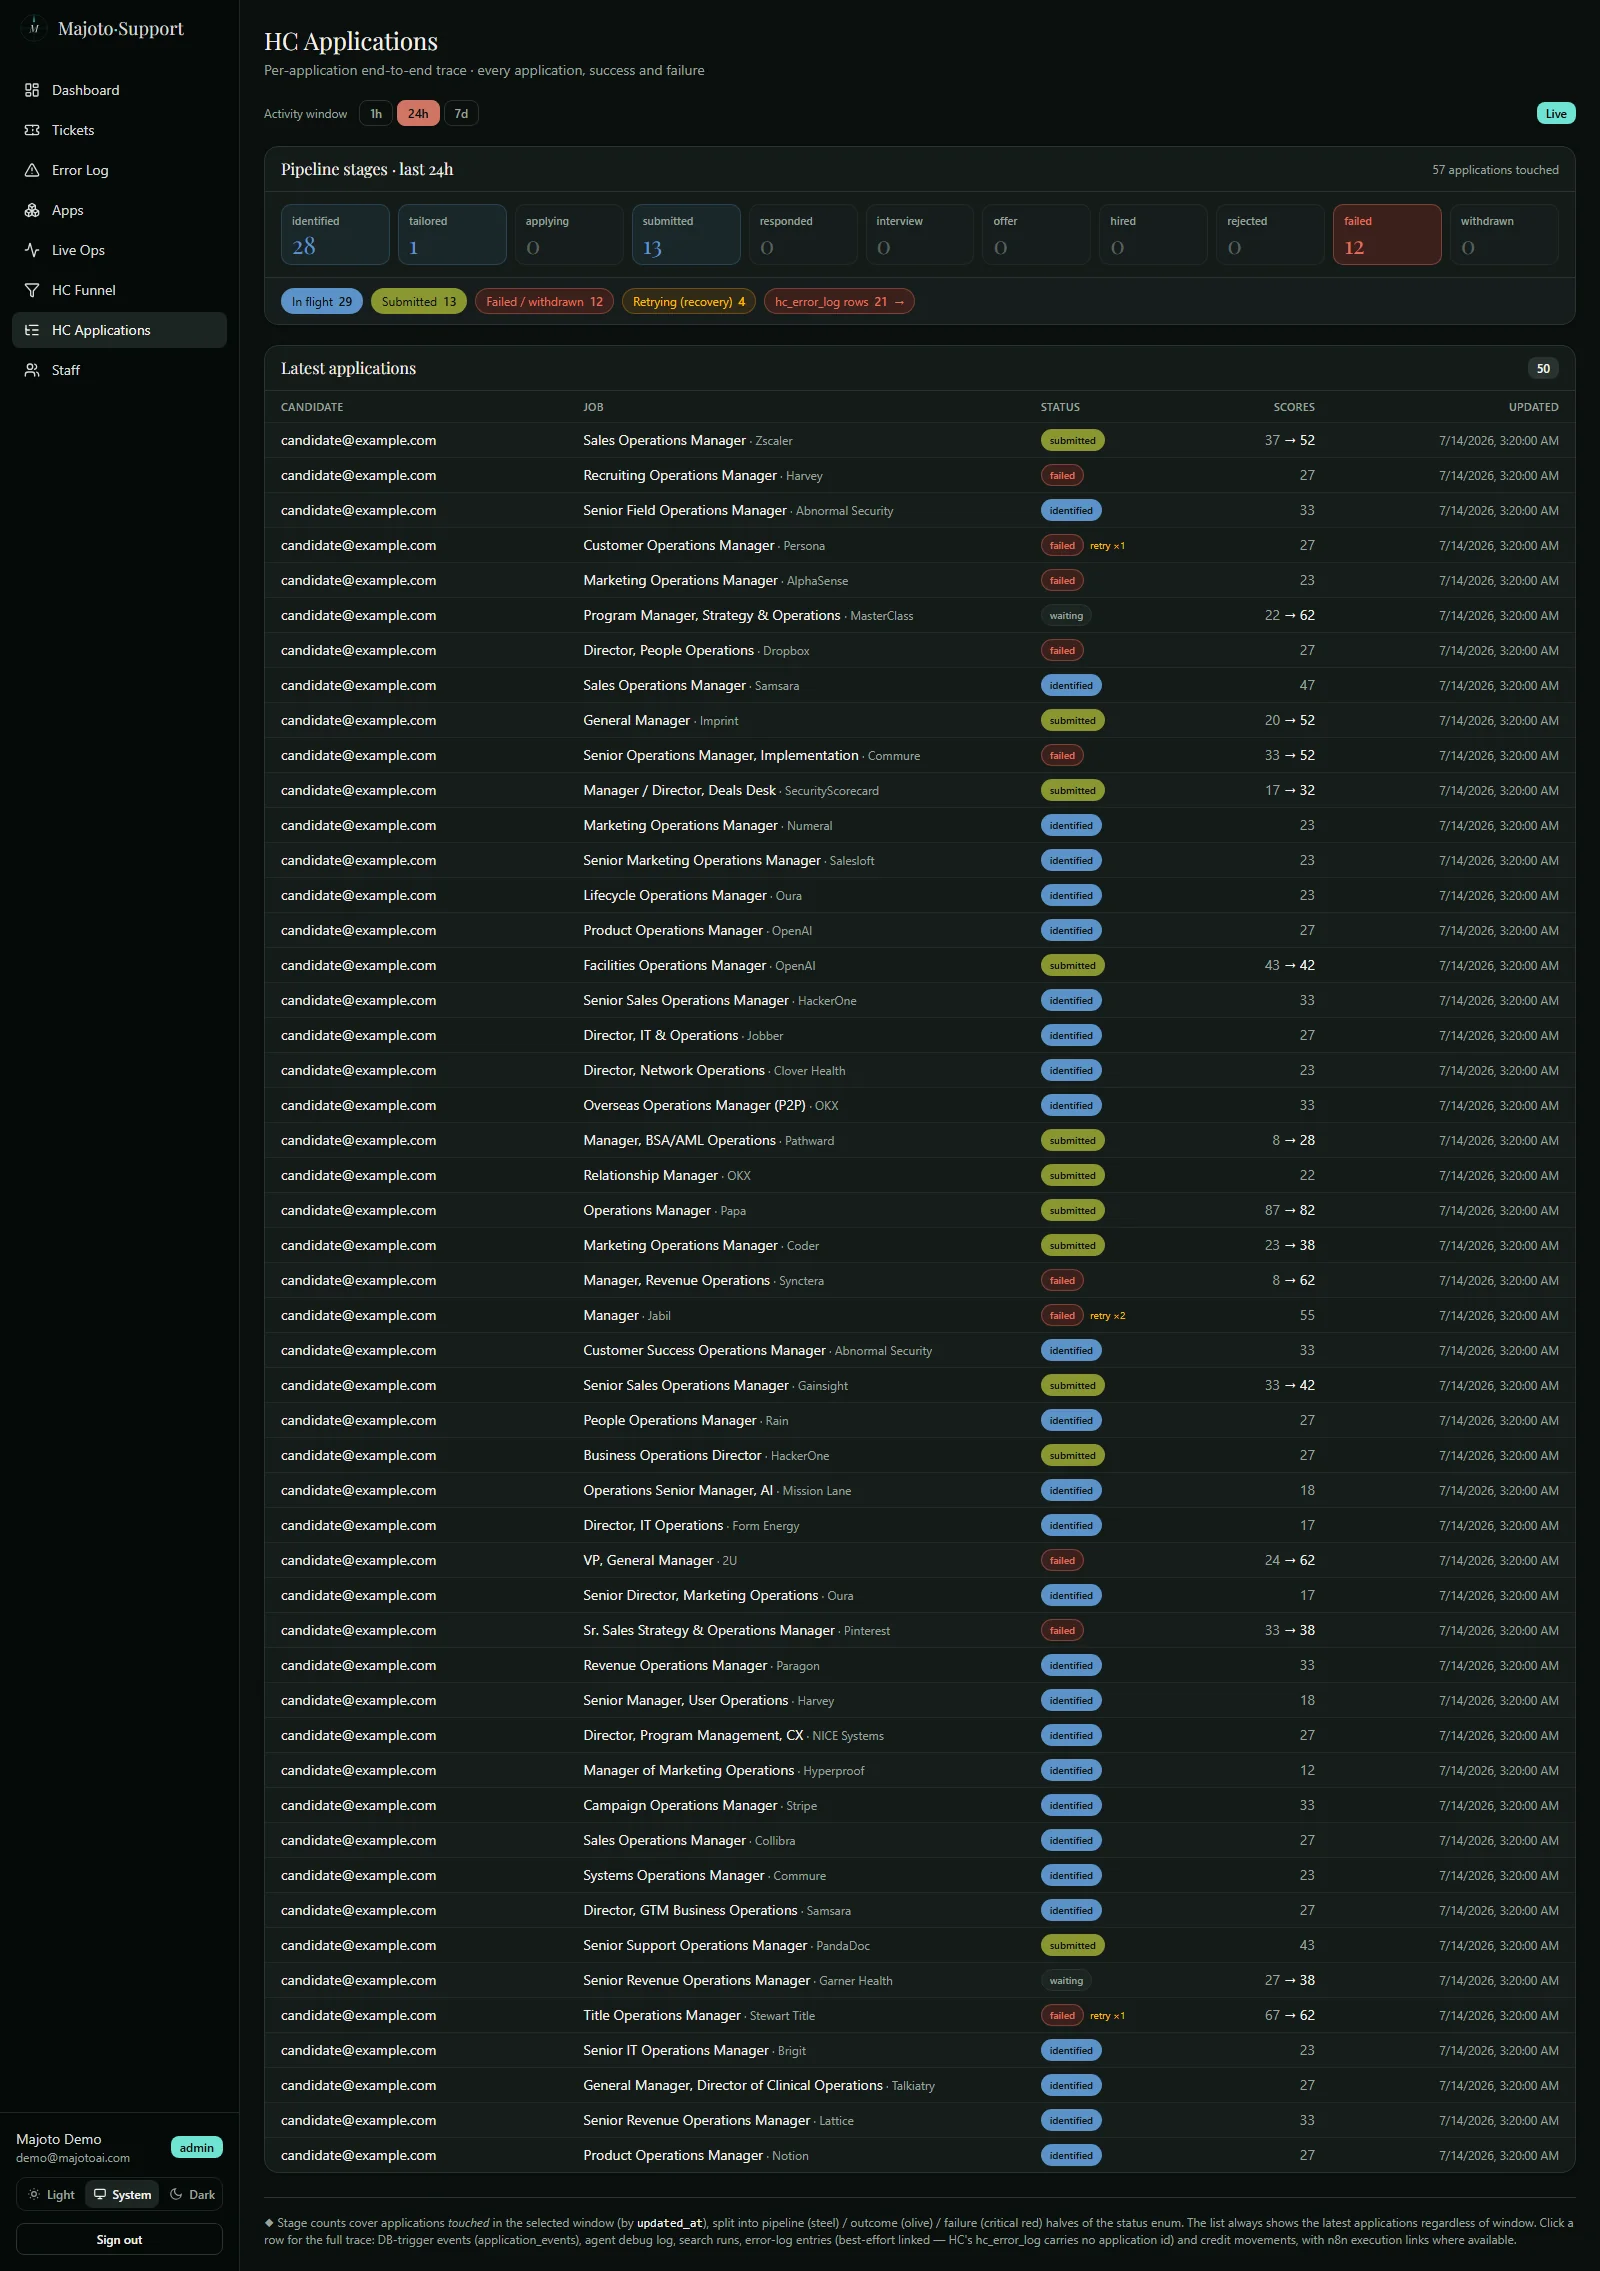
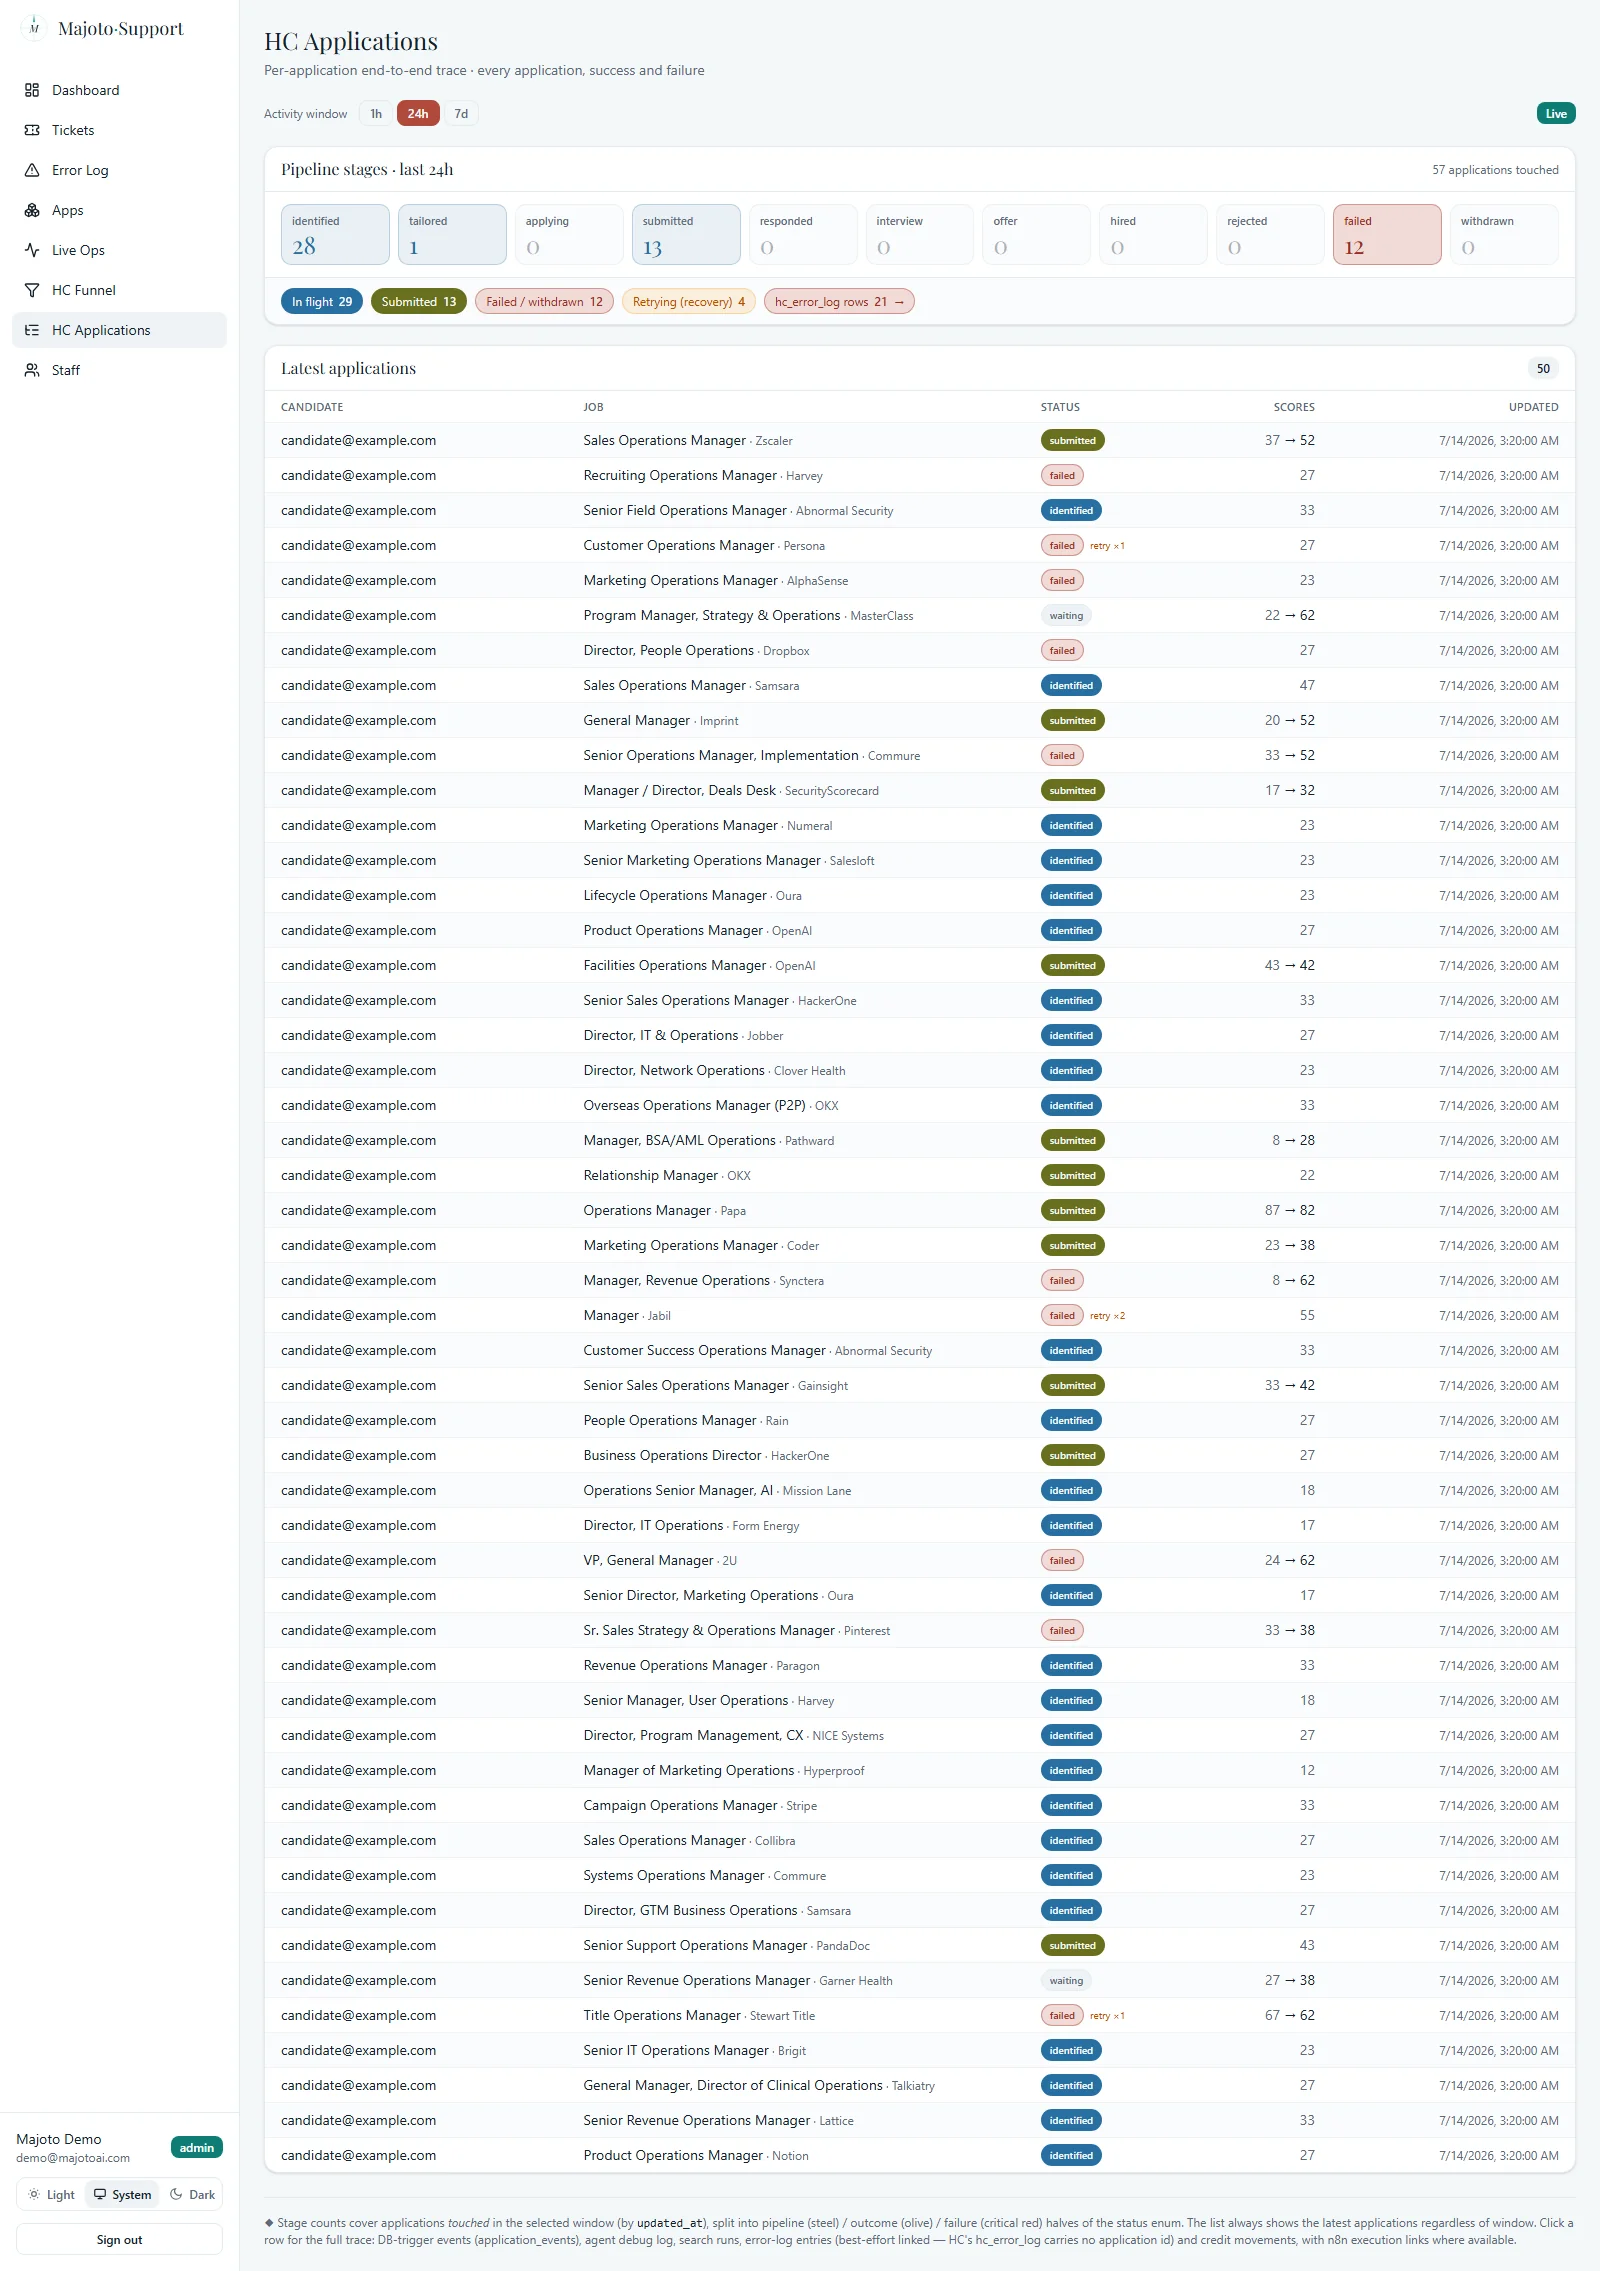
HC Applications view in dark theme: truthful pipeline stage counts from identified through hired, rejected and failed, over a latest-applications table with status chips and match scores HC Applications view in light theme: truthful pipeline stage counts from identified through hired, rejected and failed, over a latest-applications table with status chips and match scores

Application pipeline

Every application our HireConcierge agents touch, success and failure alike — truthful stage counts across the whole pipeline (in-flight, submitted, outcomes, and the failure column no one likes to show), with retry and error signals surfaced instead of hidden. Selectable 1h / 24h / 7d windows; click any row for the full trace below.
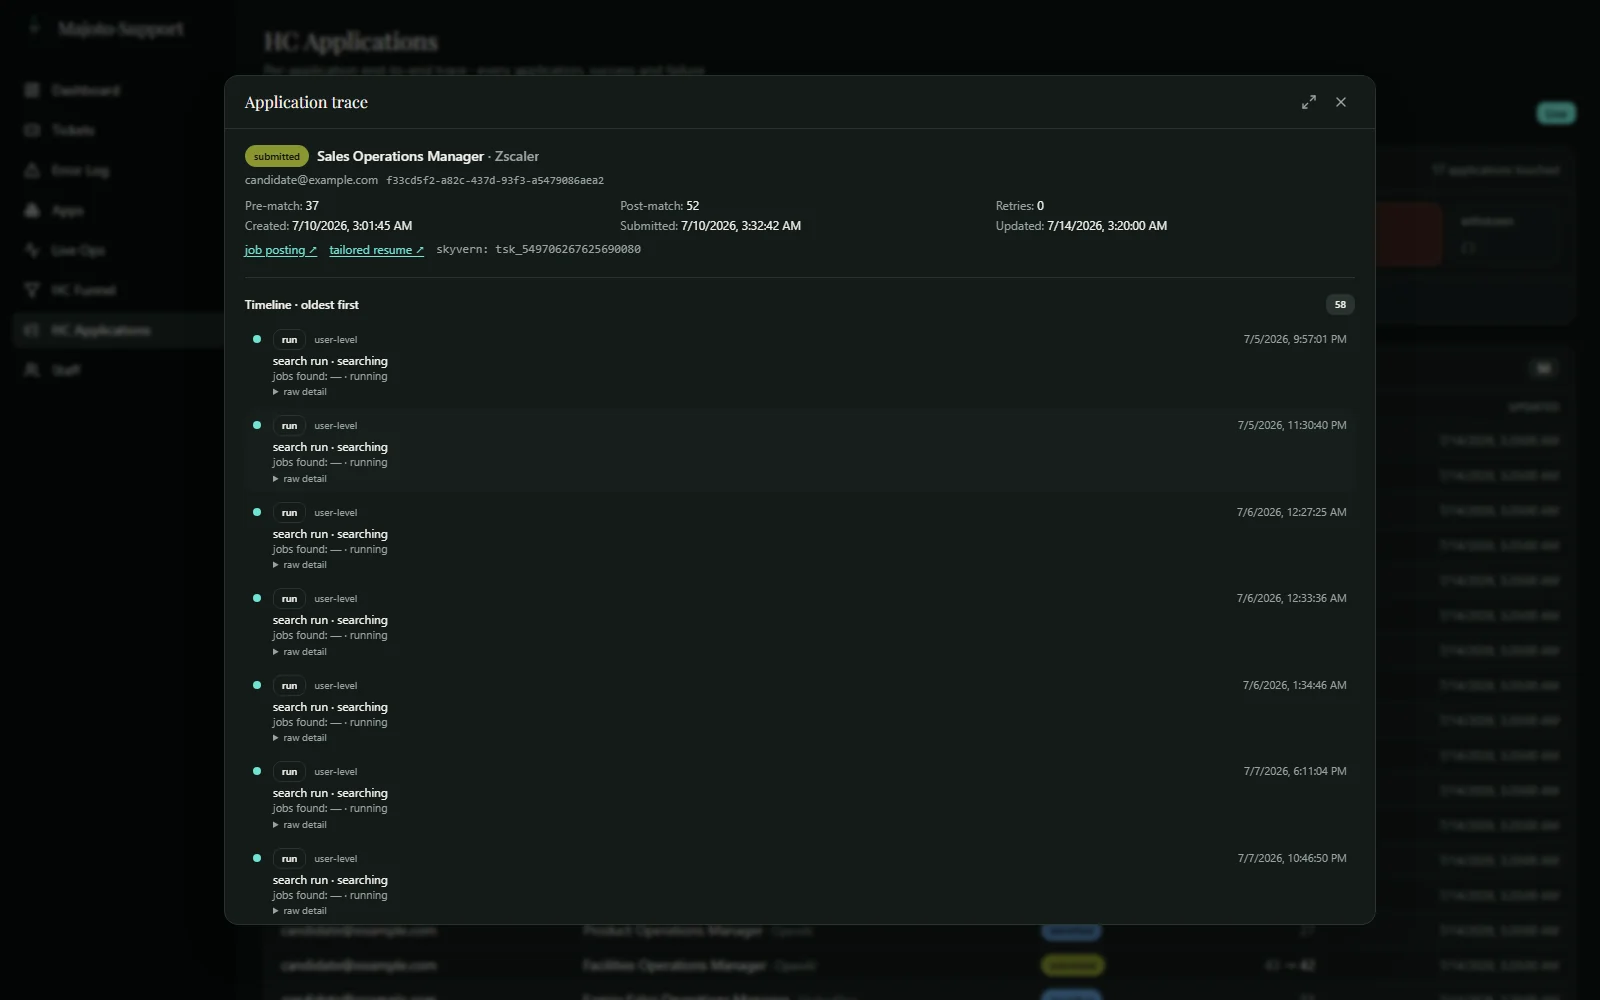
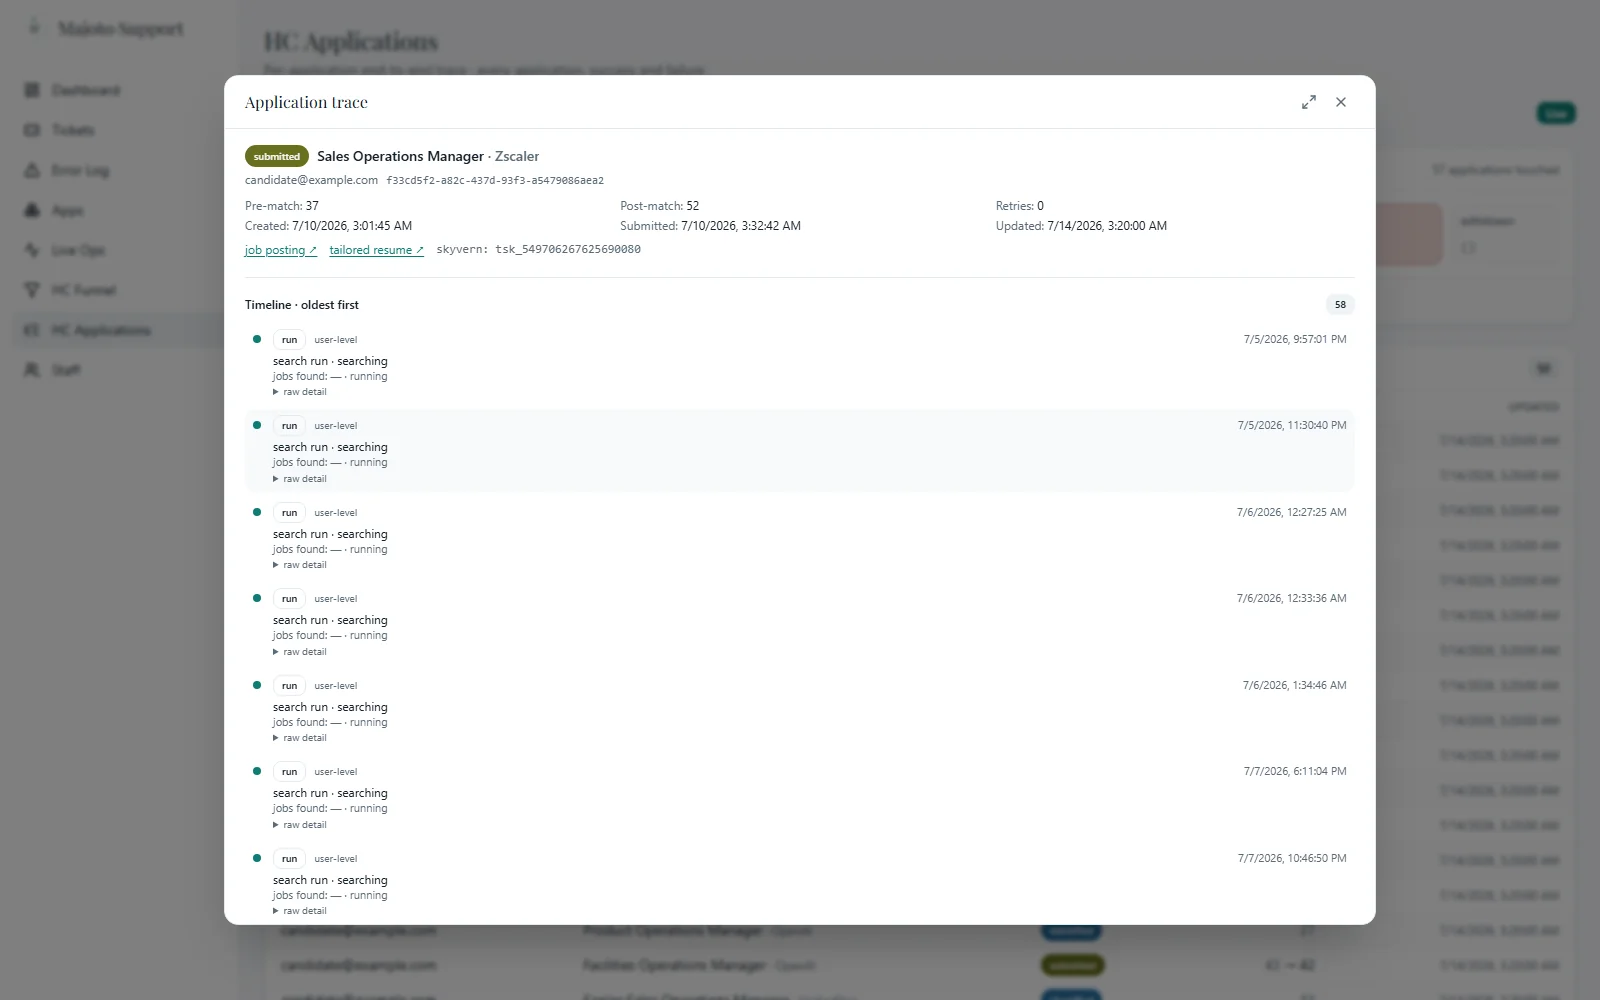
Application trace modal in dark theme: a chronological timeline of one job application, from search run and match through resume tailoring, credit movements and status changes to submission, each with expandable raw detail Application trace modal in light theme: a chronological timeline of one job application, from search run and match through resume tailoring, credit movements and status changes to submission, each with expandable raw detail

End-to-end application trace

The observability piece: one chronological timeline per application that reconstructs everything the agents did — the search run that found the job, the match and its score, resume tailoring, credit movements, and every status change through submission, each entry with its raw detail. When a customer asks “what happened with my application?”, the answer is one click, not a database dig.
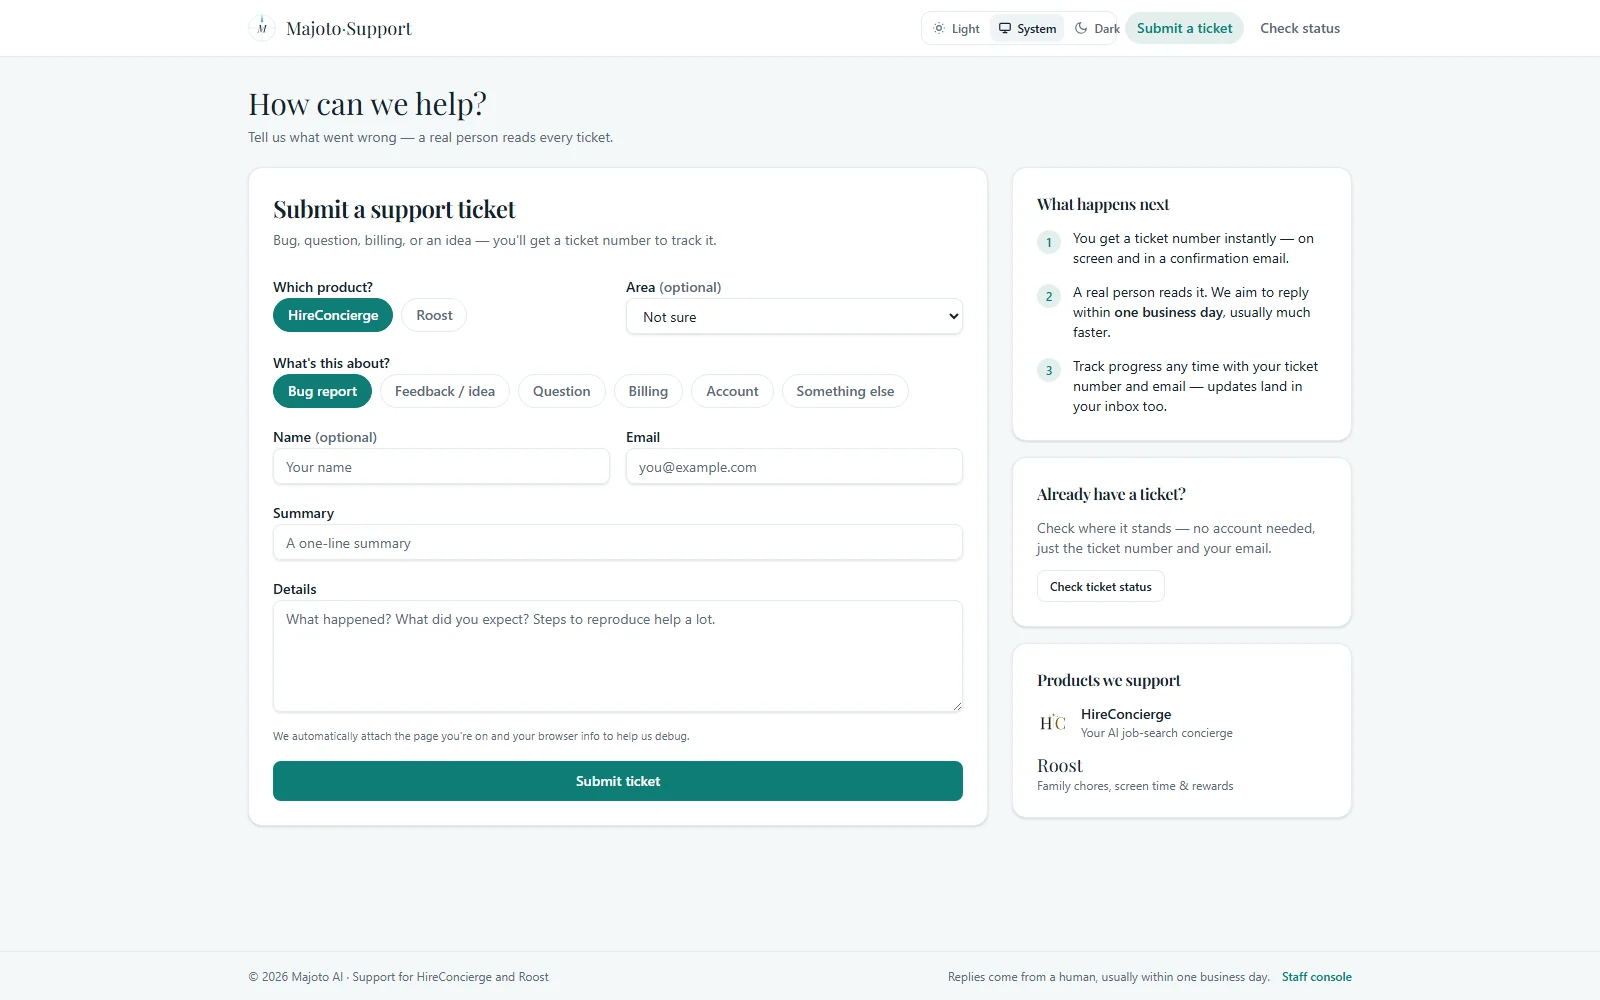
Public support ticket form: product picker, category chips, and summary and details fields on a clean Atrium light page with the Majoto compass logo

Public ticket portal

The side our users see — a clean, no-login support form at support.majotoai.com with a product picker, category chips, and a ticket number they can check status on later. Spam-guarded, rate-limited, and wired straight into the staff console above.

← Back to the portfolio

Want a command center for your business?

This platform started as a workflow on paper. Book a free 30-minute architecture review and we'll map yours — where AI fits, and where it doesn't.

Book a Free Architecture Review